Welcome Back To The Courthouse

Welcome Back To The Courthouse

Last March, at the very beginning of what became a pandemic, we were in San Francisco where some of the first COVID-19 cases were showing up in the U.S. Our clients were in the midst of putting on their case in the Capacitors trial in front of a live jury in Federal Court in the Northern District of California. Dr. Jim McClave’s testimony was up next. On the eve of taking the stand, we got the notice the court was shutting down and pressing pause on the trial. That pause turned indefinite and eventually the jury was dismissed and trial was set for a later date. 

That was the start of our at-home, virtual environment that we all have grown accustomed to now over a year later. Meetings, depositions, hearings, and even trials over Zoom have become commonplace — and I think we all have come to appreciate the efficiency they provide. We’ve grown to love the occasional interruption by a barking dog or child in need of a snack or help on their math homework. Anytime we get to sleep in our own beds the night before testifying, we are pretty happy campers! 

Even with the advantages of the Zoom era, there is simply no substitute for an in-person jury trial. The atmosphere and engagement is hard to achieve with any other setting, no matter how great the technology (or how quiet our pets are!). The environment and energy is what we live for. 

And this was very clear to us last week as we had our first in-person jury trial since the shutdown. Social distancing and masking were prevalent. Hand sanitizer was readily available. The number of people allowed in the courtroom was limited. And because courts are still largely working remotely, even the parking was easy! 

The atmosphere was what we have come to know and love in our line of work. Dr. McClave was able to look the jurors in the eyes and explain complex, statistical analysis in bite size, easy-to-understand pieces with the aid of helpful and beautiful demonstratives created by our talented Marketing and Communications team.

“The judge clearly paid close attention to my testimony, and even at some point when we were talking about multiple regression analysis, said something to the effect that statistics was the reason she went to law school rather than medical school, to which the jury responded with nods and laughs — I told her I understood,” Dr. Jim McClave said.

 The jurors were engaged — nodding along, taking notes and making eye contact. And during cross examination, they were clearly not swayed by the examiner. 

“Jamie and I were both surprised that the Plaintiff did not put on any witnesses after my testimony (they had the opportunity to present rebuttal witnesses), so the last thing the jury heard from witnesses was the presentation we all worked so hard on,” Dr. Jim McClave added.

When the jury came back with a finding in favor of our client, it confirmed the effectiveness and irreplaceable value of in-person court appearances. How gratifying it was to see our client get a favorable result in a case that has been litigated since 2016 and has gone up and down the appeals circuit. 

With three trials scheduled in the next several months, our bags (and masks) are packed. Our vaccines are administered. We are ready to go. See you at the courthouse. 

To P-Value or To Not

To P-Value or To Not

Dr. Jamie McClave Baldwin

Dr. Jamie McClave Baldwin

In an article enumerating the dos and do nots of statistical significance published in The American Statistician, Dr. Ronald Wasserstein et al. said the following:

“We summarize our recommendations in two sentences totaling seven words: ‘Accept uncertainty. Be thoughtful, open, and modest.’”

Seems like simple advice — applicable to anything and something most people would agree with. So what’s all the fuss and why does this need to be stated by the uppermost authorities in the statistical world?

The heart of that debate goes like this. Many academic journals have long required a study to show statistical significance, associated with a low p-value (typically less than .05) in the results to qualify for inclusion in the journal. This seemed reasonable on the surface — a study needed to show some sort of important effect to be included in the body of knowledge for that field. Unfortunately, this led to abuse. Authors would “p-hack” and manipulate results to get statistical significance in order to get published. So now these academic journals face a conundrum. 

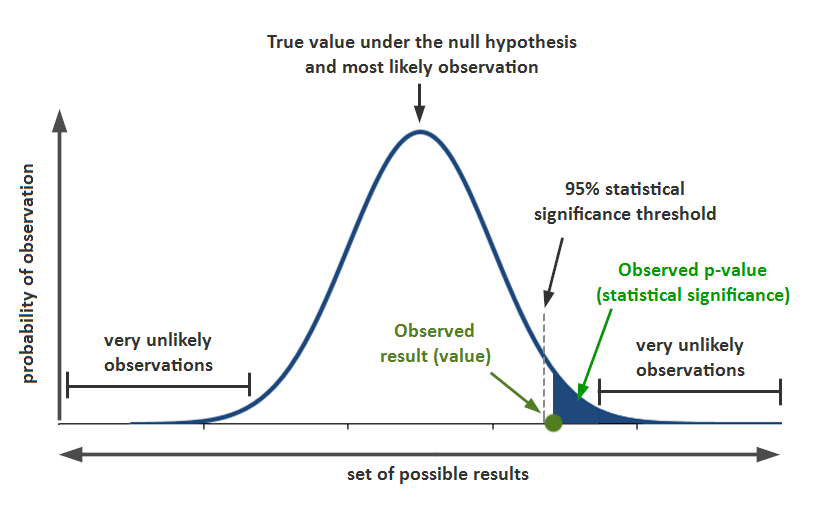
If they drop the statistical significance requirement, do they run the risk of letting in junk science and irrelevant material? Or if they continue the requirement, are they encouraging bad scientific practice, potential false positives, and a myriad of other scientific problems? The answer suggested by the statistics community, and practiced by Infotech since its inception, is that those choices fall into the fallacy of the false dilemma. Neither extreme is right and those extremes are not the only choices. Context is essential; honesty is crucial; and integrity is everything. The statistician is not just a person pressing a magic button that produces mysterious results that only he or she can unlock. Statistics is a toolbox and the statistician is the handywoman.

Wasserstein’s ultimate advice is right: accept uncertainty. The p-value may shed light on the amount of uncertainty, but it does not eliminate it full stop.

Throwing out p-values as a whole is inappropriate and would disregard hundreds of years of statistical theory. Recognizing that p-values have limitations and must be considered in context – how large is the sample, are the results also practically significant, do other tests confirm the results – is also a necessary part of science. Studying new and improved tools for evaluating hypotheses has its place as well. In the end, if the effect doesn’t reach statistical significance, that may still provide direction for future research or different avenues to travel. It may tell you that you have another statistical problem, such as multicollinearity, too little information, confounded effects, omitted variables. Or it may tell you that there is no relationship between the variables of interest. No news is neither good news or bad news; but it is news.

Slack Chat Team Question – COVID-19

Slack Chat Team Question – COVID-19

Anomalies are not usually a golden opportunity for data – they’re usually classified as outliers. But COVID-19 is not a normal anomaly, in any way, shape or form, and the surge of statistics circulating the internet about any given aspect of the virus and its impact (or potential impact) gave our team of data junkies a hot topic to hash out in their Slack Chat Team Question.

Jamie McClave Baldwin (Dr. Jamie McClave Baldwin – President, Expert Statistician): Depending on your news source or website, the analytics and recommendations continue to be all over the place concerning the spread, contagion, and best way to prevent or end COVID-19. So my question to our crack team of data junkies and analysis addicts is this: If you could access any data you wanted, what would that be and what analysis would you do to learn more about COVID-19?

Paula Mullally (Paula Mullally – Senior Case Analyst): Without really knowing much about epidemiology, maybe spread patterns of previous viruses including measures taken country by country and at what point during the spread? Logistics networks for medical supplies that are most needed for containment.

Chuck Girard (Senior Data Analyst): Given that we haven’t had a world-wide epidemic like this in 100 years, but have had several smaller outbreaks in the last 20, I would want to know a lot of background demographic, environmental, socioeconomic, behavioral, health information about the patient 0(very low number) population in order to try to determine what is causing this seemingly unusual increase in the outbreaks of deadly diseases. We’ve had SARS, Ebola, and several others recently. Then, of course, COVID-19 this year. What will we have next year? In what ways are we possibly contributing the origin, spread, or deadliness of these diseases? Climate change, antibiotics, something else in the food/water supply… aliens…

Janese Nix (Janese Nix – Statistical Consultant): Has anyone seen any reports on hospital beds and ICU beds/person by community or region? Any reports of increased capacity? I’ve seen articles that talk about increases but not any tracking of that info.

This is a cool site for tracking Florida activity. It doesn’t estimate the onset (symptomatic) but diagnosis. It is more up to date than the CDC, since it updates more often. https://fdoh.maps.arcgis.com/apps/opsdashboard/index.html#/8d0de33f260d444c852a615dc7837c86

It’s got age demographics by county which is cool as well as number hospitalized. Alachua County had 5 hospitalized yesterday and 4 today. That may mean that one patient has been discharged (and recovered). Other countries are reporting numbers of recovery but I haven’t seen that for the US.

Paul Manning (Paul Manning – Director, Data Management): Data update: The Institute for Health Metrics and Evaluation (IHME) is an independent global health research center at the University of Washington. They have been identified as a “legitimate” source for COVID projections. Their hospital resource used analysis to provide US and state by state projections for beds, ICU beds, and ventilators. Their numbers imply that local officials may be making requests based on worst-case scenarios instead of expected values, i.e. 20k (40k upper 95% UI) ventilators will be needed nationwide at the peak while Mr. Cuomo is requesting 30k for NY alone.

The good/bad news for us (Florida) is we are flattening the curve better than most but our peak occurs in mid-May which is a month after the US and 2 weeks later than most every other state. Plus we will have no bed shortages and actually will continue to have high excess capacity. What is causing Florida’s curve to be so different from the rest of the country? Are our medical facilities better than most because of our older population or is the delay a result of the late migration of New Yorkers?

Institute for Health Metrics and Evaluation – IHME | COVID-19 Projections

Explore hospital bed use, need for intensive care beds, and ventilator use due to COVID-19 based on projected deaths for all 50 US states and District of Columbia

Paula Mullally: So what you’re telling me is that we’re all going to be working from home until June.

Dr. Allison Zhou (Senior Economic Consultant): Weather. Dr. Fauci may disagree, but I think weather matters. Our summer arrives earlier and more noticeably than any other states, which I think makes a difference. Only wish it would be drier. @paula.mullally Stay cool in our cocoons. We should be fine soon (wishfully ). I saw the!  

Jamie McClave Baldwin: I hadn’t seen ICU beds by region or per capita. In fact, I think much of what has been missing from the equation here is per capita and demographic breakdown. For example, China has a higher male to female ratio among adults than most other countries in the world. So we kept hearing that this affected men more than women, but was that a factor of the male:female ratio or was that real? Also USA deaths are pretty high but per capita are on the lower end of the spectrum. We keep hearing about NYC but isn’t that the MSA with the highest population density in the US? Show the a logistic regression with population density, sex, age, an indicator for whether the government has imposed shelter-in-place, what else? Maybe some economic measures? Per capita income? Might be too correlated with pop dens.

Jim McClave (Dr. Jim McClave – CEO, Founder, Econometric Expert): Might want to include ethnicity in the model. I saw stats this morning from Switzerland indicating a big range of death rates ranging from 0.6% for German speaking cantons (I admit I didn’t know what “cantons” were until Google informed me they are the 26 member states that comprise Switzerland) to 4.4% for Italian speaking cantons. Of course, there may be numerous confounding factors that explain the differences, as well as sample size deficiencies.

Ed See (Dr. Edward See – Senior Economic Analyst): I would look at the testing rate first. I suspect the reason why the US jumped other countries in the number of confirmed cases could be that the US is more aggressive in testing (less testing means less chance of getting positive cases).

Jamie McClave Baldwin: But are we testing aggressively? How do we know? I hear anecdotal stories all the time about people being turned away from testing. Also, with all of the various tests being put forth for COVID-19, anyone concerned about false negative or false positive rates? I haven’t been able to tell from the news what kind of testing they have done to assess the accuracy of the tests.

Ed See: Some countries are reporting that China supplied them with defective testing kits.

Jamie McClave Baldwin: @edward.see I hadn’t heard that. Interesting. I’m definitely concerned about the false negatives. If we are all supposed to act like we have it, the false negatives are not helping that behavior!

Jodie Newman (Jodie Newman – Director, Case Development): I have a running text chat with friends in Gainesville, several of whom are physicians. They say that the medical community is talking about the lack of really any data on false test results. 

Jodie Newman: I wonder whether there isn’t a relationship yet because physical distancing seems so subject to “cheating” — e.g., I am going to go out and run errands and it’s ok as long as I stay 6 ft from everyone. Maybe measuring rates of infection for those who followed “stay at home” vs. not. On the other hand, the rates of infection data is going to be impacted by the reality that many are not being tested — in my parents’ community, no testing unless you are ready for admission in the hospital or a healthcare prof.

Jamie McClave Baldwin: What originally got me thinking about data was the chart I saw on social distancing, as measured by the reduction in movement tracked by cell phones. They compared that reduction in movement to daily reported cases – and there was no obvious relationship yet. Got me thinking about how we might test that. How would we measure the effect of social distancing? How do you best measure social distancing in the first place? 

Janese Nix Did the analysis you saw take into account the variable time from exposure to symptoms to positive test? This can be as short as 1 day and as long as 24. Some models are working with a minimum of 5 day lag, but that time would be different as diagnosis and testing time and behaviors change. 

Jamie McClave Baldwin: There was no lag incorporated. I want to see some moving averages about both social distancing and number of cases. 

Erica Bloomberg-Johnson (Senior Case Analyst): Would be interesting to observe and analyze post COVID-19, the amount of research/innovation that occurred in that period of time. Instead of “What drives Winning,” it is “What drives Innovation.”

Janese Nix: We are seeing both increased collaboration even multicultural, and increased competition (the race for a faster test, effective treatment…). And open source innovation with abilities to add on and share.

Jamie McClave Baldwin: There was a hackathon in Switzerland (I think?) last weekend. 72 hours of global innovation around these questions.

Ed See: Not just innovation but also dedication to invest in pandemic virus vaccines. Pandemic virus vaccines may not be profitable for investors since pandemics are rare and no one invested in it. 

Ed See: On the shortage of ventilators:

“Government officials and executives at rival ventilator companies said they suspected that Covidien had acquired Newport to prevent it from building a cheaper product that would undermine Covidien’s profits from its existing ventilator business.” The U.S. Tried to Build a New Fleet of Ventilators. The Mission Failed.

As the coronavirus spreads, the collapse of the project helps explain America’s acute shortage.

Allison Zhou: UF researchers lead the way in rapidly designing, building low-cost, open-source ventilator As a University of Florida mechanical engineering student decades ago, Samsun Lampotang, Ph.D., helped respiratory therapist colleagues build a minimal-transport ventilator that became a commercial success.

Allison Zhou: Isn’t it cool? I feel so proud.

Erica Bloomberg-Johnson: I get articles from Wards after doing research for a previous case. Interesting article on how automakers are dedicating manufacturing support. WardsAuto article.pdf

Jamie McClave Baldwin: All of this talk, and not one of us has brought up the antitrust violations that are sure to come out of this or how to navigate the necessary coordination to defeat this thing. I predict we will have to add a COVID-19 effect into models spanning this time for the price effects this thing has had on nearly everything we purchase. A chat for another time, I suppose. Be well, my friends.